

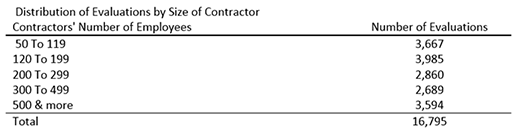
In calculating the chances or probabilities of receiving non-compliance notices, I am using the data on 16,795 contractors. These contractors had at least 50 employees and they were in states and industries with at least 100 evaluations. Size of the contractors in this review is approximated by the number of its employees. The distribution of the contractors by the number of employees is shown in table below.
 |
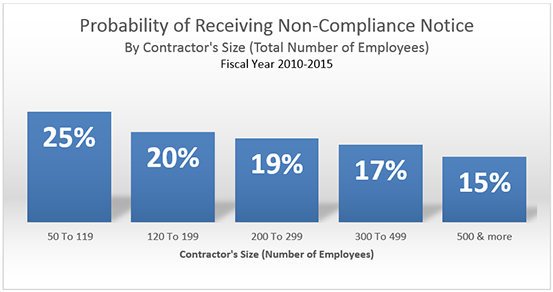
A review of the chance or probability of receiving non-compliance notices indicates that the probability of receiving a non-compliance notice is higher for smaller contractors. The probability of receiving a non-compliance notice for contractors that had between 50 and 119 employees was 25%, which means the OFCCP issued 25 non-compliance notices for each 100 contractors it reviewed in this size category. On the other hand, the OFCCP issued only 15 non-compliances for every 100 contractors that had more than 500 employees. As the graph below shows, the contractors’ size or the number of employees has a dampening effect on the probability of receiving non-compliance notices. As the contractors’ size increases, the chance of receiving non-compliance notices proportionally decreases.
 |
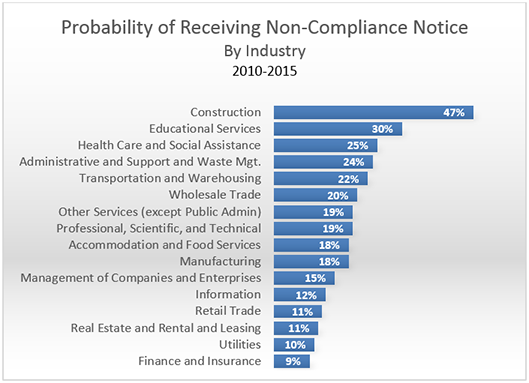
A review of the chance or probability of non-compliance notices by industry indicates that the OFCCP issued substantially more non-compliance notices for contractors in the Construction industry, compared to other industries. While in the Construction industry, the OFCCP issued 47 non-compliance notices for each 100 evaluations, the number of non-compliance notices issued for each 100 evaluations in the Finance and Insurance industry was only 9.
 |
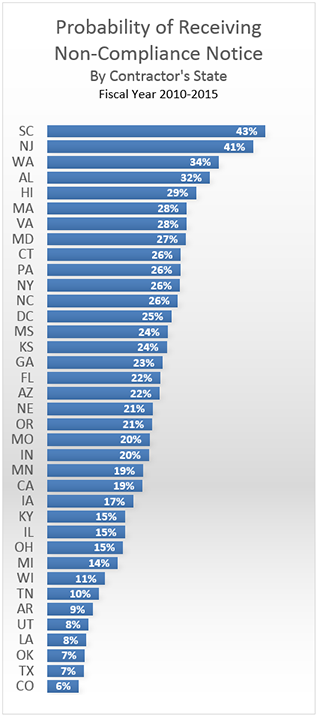
The chance of receiving non-compliance notices also varied by the geographic location. Overall, the contractors in South Carolina had the highest chance of receiving non-compliance notices. In South Carolina, each 100 evaluations resulted in 43 non-compliance notices. Similarly, in New Jersey, Washington, Alabama, and Hawaii each 100 evaluations resulted in 41, 34, 32, and 29 non-compliance notices. In contrast, in Colorado each 100 evaluations resulted in only 6 notices of non-compliance. Similarly, in Texas and Oklahoma, each 100 evaluations resulted in 7 notices of non-compliance; and in Los Angeles and Utah, each 100 evaluations resulted in 8 notices of non-compliance.
 |
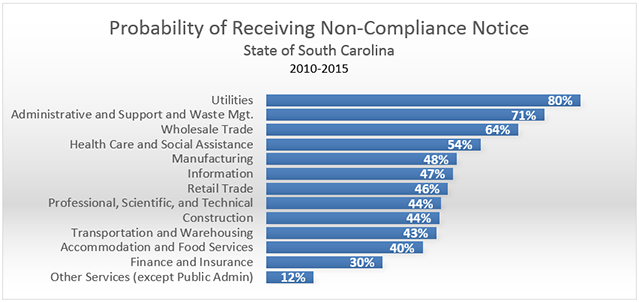
It is interesting to see how the probability of receiving non-compliance notices varies across different industries in the states with the highest and lowest probability. In South Carolina, each 100 evaluations in the Utilities industry resulted in 80 non-compliance notices while each 100 evaluations in the Other Services industry resulted in only 12 non-compliance notices.
 |
In New Jersey, each 100 evaluations in the Administrative and Support and Waste Management industry resulted in 65 non-compliance notices while each 100 evaluations in the Utilities industry resulted in only 8 non-compliance notices.
 |
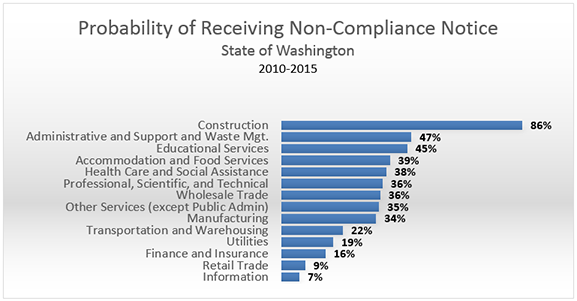
In the state of Washington, each 100 evaluations in the Construction industry resulted in 86 non-compliance notices while each 100 evaluations in the Information industry resulted in only 7 non-compliance notices.
 |
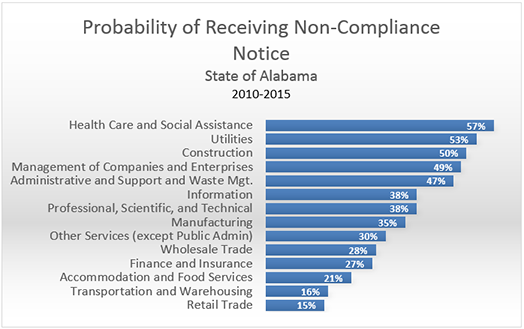
In Alabama, each 100 evaluations in the Health Care and Social Assistance industry resulted in 57 non-compliance notices while each 100 evaluations in the Retail Trade industry resulted in only 15 non-compliance notices.
 |
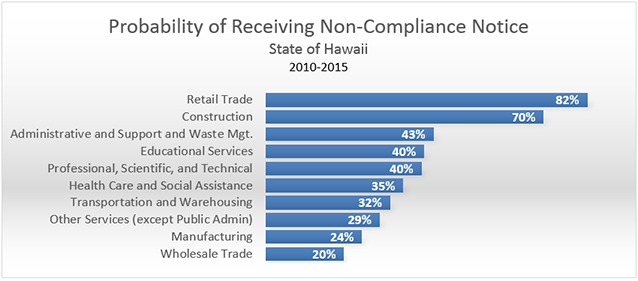
Finally, in Hawaii, each 100 evaluations in the Retail Trade industry resulted in 82 non-compliance notices while each 100 evaluations in the Wholesale Trade industry resulted in only 20 non-compliance notices.
 |
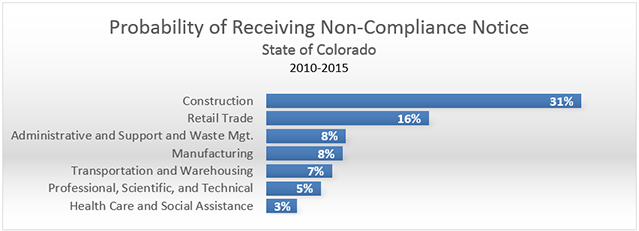
The states with the lowest probability of receiving non-compliance notices also exhibited variation across industries. For example, in Colorado, each 100 evaluations in the Construction industry resulted in 31 non-compliance notices while each 100 evaluations in the Health Care and Social Assistance industry resulted in only 3 non-compliance notices.
 |
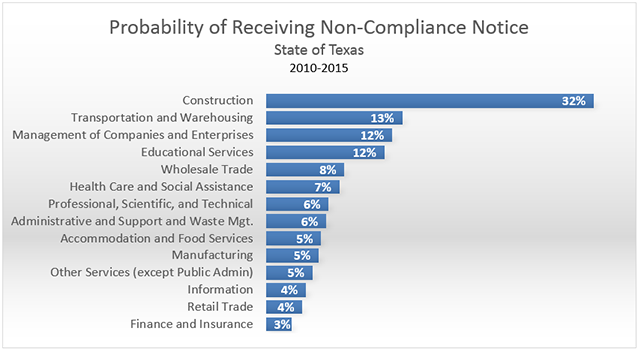
In Texas, each 100 evaluations in the Construction industry resulted in 32 non-compliance notices while each 100 evaluations in the Finance and Insurance industry resulted in only 3 non-compliance notices.
 |
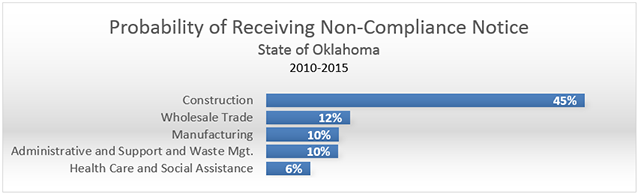
In Oklahoma, each 100 evaluations in the Construction industry resulted in 45 non-compliance notices while each 100 evaluations in the Health Care and Social Assistance industry resulted in only 6 non-compliance notices.
 |
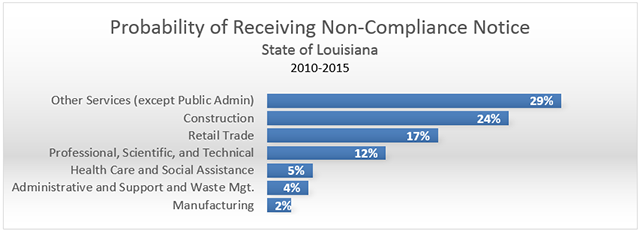
In Louisiana, each 100 evaluations in the Other Services industry resulted in 29 non-compliance notices while each 100 evaluations in the Manufacturing industry resulted in only 2 non-compliance notices.
 |
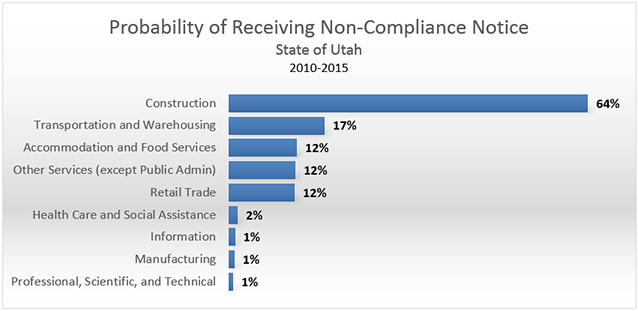
In Utah, each 100 evaluations in the Construction industry resulted in 64 non-compliance notices while each 100 evaluations in the Professional, Scientific, and Technical industry resulted in only 1 non-compliance notice.
 |
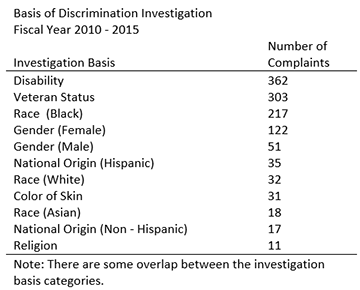
In the final section of this part, I will quickly review the Compliant Investigations database. This database contains 843 investigation records; 137 or about 16% of these records are related to class action complaints; and 697 or about 84% are related to individual complaints. A further review of the database reveals that the majority of investigations are in the Disability and Veteran Status categories. The table below shows the frequencies of the complaints in different categories.
 |
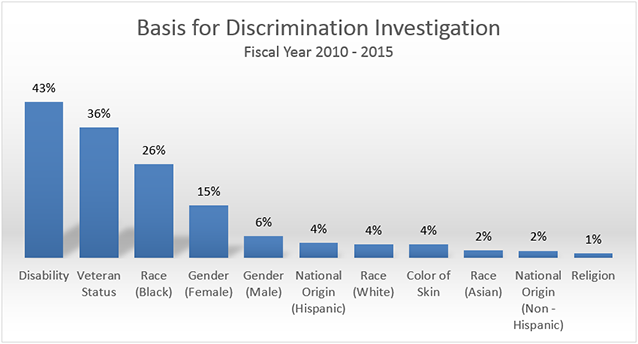
The graph below shows the same information in percentage terms.
 |
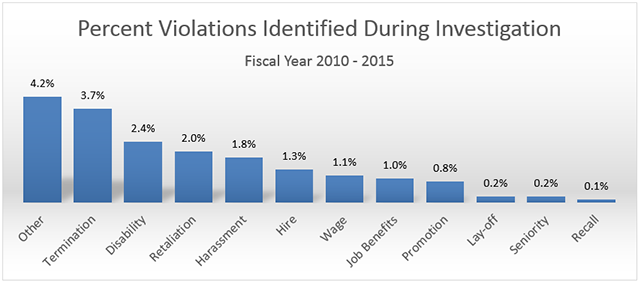
When the results of the OFCCP’s investigations are reviewed among 834, skipping the “Other” category, the highest number of violations identified by the OFCCP is in the Termination category. The table below shows the number of violations that the OFCCP has identified among the 834 investigations.
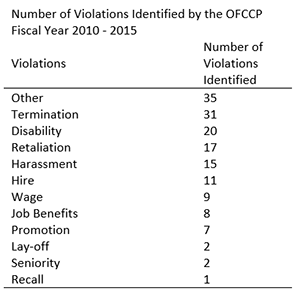 |
As the following graph shows, in all violation categories the percent of violations identified is below 5%. The OFCCP’s investigation of 843 complaints resulted in finding Termination violations in 3.7% of the complaints, Disability Status violations in 2.4% of the complaints, and Retaliation violations in 2% of the complaints. Violations in the rest of the categories were less than one percent.
 |